Genonets input-file format
The input file must be in the Tab Separated Value (TSV) format (columns are separated by tabs). The first row must always comprise the column headers, which are: Genotypeset, Genotype, Score, and Delta. The parser is agnostic to the order of the columns, but case-sensitive.
Note
Missing values are not permitted in the Genonets input file format.
Column attributes
Each row after the headers represents attributes of a single genotype. The Genonets input file format requires that the following four attributes (corresponding to the column headers) be defined for each genotype:
Genotypeset
Unique name/identifier of the genotype set to which the genotype belongs. A genotype may fall within the intersection of multiple genotype sets. In this case, the genotype must be specified in multiple rows, with one row corresponding to one of the genotype sets. Then, the number of rows in which the genotype appears would correspond to the number of genotype sets that contain the genotype.
Genotype
The genotype, as a sequence of letters from the required alphabet type. All genotypes in the input file must be of the same alphabet type, and of equal length.
Score
Quantitative phenotype value corresponding to the genotype. In cases where the value is not available, it should be replaced by ‘0’.
Delta
Noise associated with the quantitative phenotype data. The same delta value must be used for all genotypes within the same genotype set, i.e., for all rows with the same value for Genotypeset. In cases where the value is not available, it should be replaced by ‘0’.
Example
Let us consider a concrete example by taking a look at the sample input file. The sample input file contains data for five Mus transcription factors. Each Genotype is an 8nt long DNA sequence, which represents a possible transcription factor binding site. The Genotypeset corresponding to the genotype is the name of the transcription factor that binds the genotype. The Score is the E-score, a measure of the relative binding affinity of the transcription factor to the DNA sequence 1 (i.e., genotype). Finally, the Delta value is a measure of experimental noise, in this case determined by comparing binding affinities on two different microarray designs. When performing landscape related analyses such as Paths, Peaks, and Epistasis, the score for each genotype is considered as a range from \(Score-Delta\) to \(Score + Delta\).
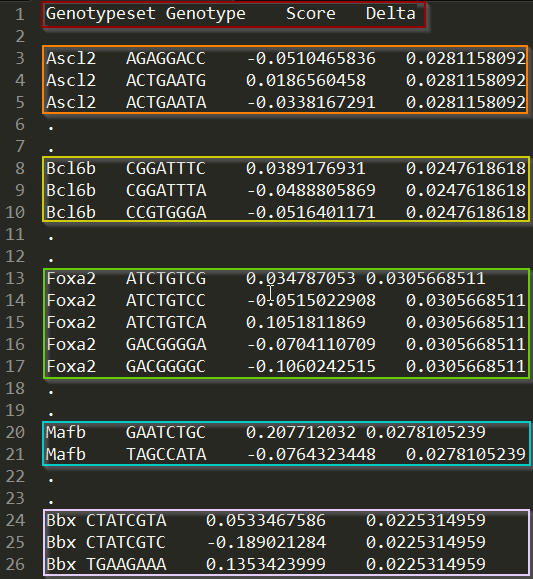
In the figure above, the first colored box shows the column headers. The colored boxes that follow highlight parts of the genotype data for the five genotype sets in the sample input file.
References
- 1
Michael F Berger et al. “Compact, universal DNA microarrays to comprehensively determine transcription-factor binding site specificities”. Nature Biotechnology 24, 1429 - 1435 (2006).